The Price of Motivation: How new year's resolutions reshapes pricing power
January drives gym demand, but the revenue peak shifts sharply downward.

Summarize article with AI


There is an intuitive assumption about January and fitness.
New Year’s resolutions increase motivation. Motivated people invest in themselves. From that, it’s easy to assume that January should also bring higher willingness to pay for gym memberships.
But that assumption hides a more important question.
Does motivation actually shift the willingness-to-pay distribution upward, or does it simply bring more people into the market at lower prices?
Industry data clearly shows that January brings volume. Gym visits are roughly 28 percent higher than in December, and around 11 to 12 percent of all annual gym sign-ups happen in that single month. What that data does not tell us is how pricing power changes when motivation spikes.
To understand that, we ran two identical pricing studies. One in December. One in January.
How we tested
We used Price Check to run two identical pricing studies for standard gym memberships in the UK. Same methodology, same screener, same product description. The only difference was timing:
- December study: n=120, fielded December 9, 2025
- January study: n=138, fielded January 5, 2026
The studies were fielded 27 days apart.
Each study produced a full demand curve and a corresponding revenue curve, showing how demand and revenue change across price points for a standard gym membership with access to machines, free weights, cardio equipment, and group classes.
The results
Key findings
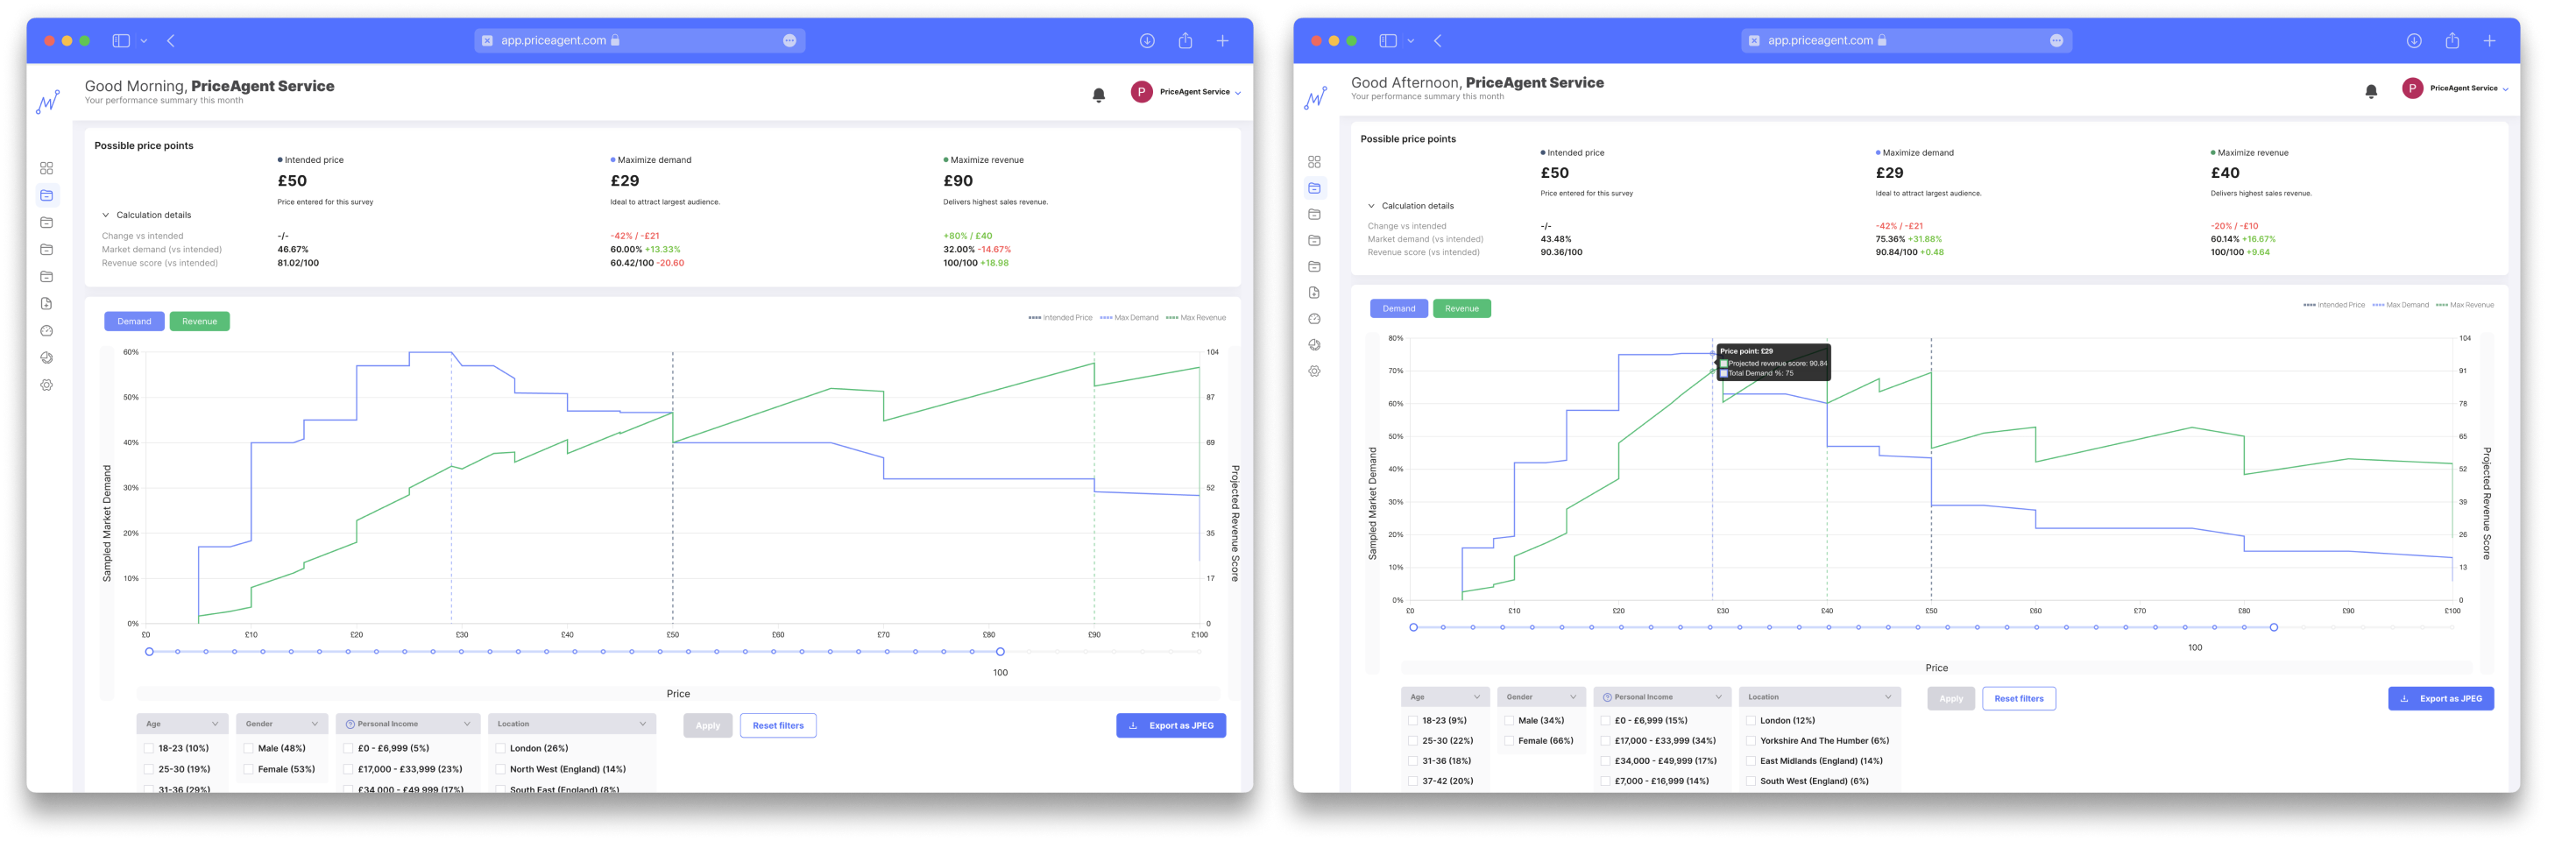
While the two studies used the same setup, the resulting demand curves looked fundamentally different.
At mainstream price levels, roughly £29 to £40, the January sample showed meaningfully higher demand than the December sample. More people were willing to enter the market at these prices, consistent with the seasonal influx driven by New Year’s resolutions.
As prices increased, however, the pattern reversed. Above £50, demand in January declined much faster than it did in December, indicating a lower tolerance for premium pricing despite higher overall interest in joining a gym.
This contrast becomes clear at specific price points. At £29, demand reached 75 percent in January, compared to 60 percent in December. At £70, the relationship flipped. Demand in January fell to 22 percent, while December retained 37 percent.
The two curves crossed at £50. Below that level, January expanded demand. Above it, December consistently showed higher demand.
This shift in demand structure had a direct impact on revenue. In the December study, the revenue-maximizing price sat at £90. In January, the revenue peak moved down to £40, reflecting a much tighter premium ceiling.
Overall, the January curve was steeper. It delivered higher demand at mainstream prices, but demand dropped off sharply as price increased, compressing the range where premium pricing could be sustained.
Why it matters
January brings more people into the market, but the demand curves show that capturing them requires a different pricing posture.
To access January demand, prices need to sit around £29 to £40. Above £50, demand falls away quickly, and the opportunity to sustain premium pricing narrows.
This reframes what “the price of motivation” actually means.
It is not what motivated buyers are willing to pay. It is what companies give up in margin to reach them.
The trade-off is not theoretical. It is visible in the curves. Volume expands at lower prices, but premium demand does not follow.
This aligns closely with how gyms already behave in January. Free first month offers, waived joining fees, short-term discounts, and no-contract messaging dominate the market during this period. Searches for “cheap gyms near me” spike sharply in late December.
Industry behavior already reflects this pattern. The demand data makes it visible.
But why the price sensitivity?
Why does the January curve look so much steeper?
One plausible explanation comes from retention data. Around 27 percent of January joiners quit by March, and only a small minority maintain long-term usage. If buyers are motivated but uncertain about follow-through, higher price sensitivity becomes a rational response.
Committing to £70 per month makes less sense when confidence in long-term behavior is low. Lower-priced options act as a hedge.
In that sense, price sensitivity reflects conviction, not just interest. This interpretation is consistent with the observed curves, but it should be read as context rather than a causal claim.
Implications for premium brands
If the January market behaves like our January sample, premium pricing becomes harder to sustain during this period.
Industry data supports this pattern. Premium gyms tend to see smaller relative gains in January, while mainstream offerings absorb most of the resolution-driven demand. The influx expands the market at the middle, not the top.
Motivation brings volume. It does not raise the price ceiling.
Conclusion
We assumed that motivation would increase willingness to pay. The demand data told a different story.
January brings more people into the market, but they cluster at mainstream prices. Demand drops steeply above £50, and the revenue peak shifts downward. In our January study, the revenue-maximizing price was £40, compared to £100 in December.
Motivation does not lift willingness to pay across the market. It reshapes the distribution.
Cultural moments like New Year create aspiration. Aspiration increases volume. But volume comes with a lower price ceiling.
To capture motivated demand, companies trade margin for reach.
That is the price of motivation.
This pattern is unlikely to be unique to gyms. Diet programs, online courses, productivity tools, and financial planning services all ride the “new year, new me” wave. The resolution economy brings demand, but demand always has a shape. And that shape matters.
---
A note on methodology: We're comparing two samples, not tracking the same people over time. The demographic differences we observed (fewer high earners in the January sample) could reflect real market change or sample variation. The interpretation is consistent with industry behaviour and retention data. But it's an interpretation, not a proven causal claim.
Explore the full studies results: December Study | January Study